Logistic Regression

In one of our previous posts, we already talked about 2 by 2 tables for binary endpoints and last week we looked at confounders. So, let's combine these two topics! 🔗 How do we take care of confounders when analyzing binary outcomes? In this case logistic regression is the right tool!💡
How does it work?
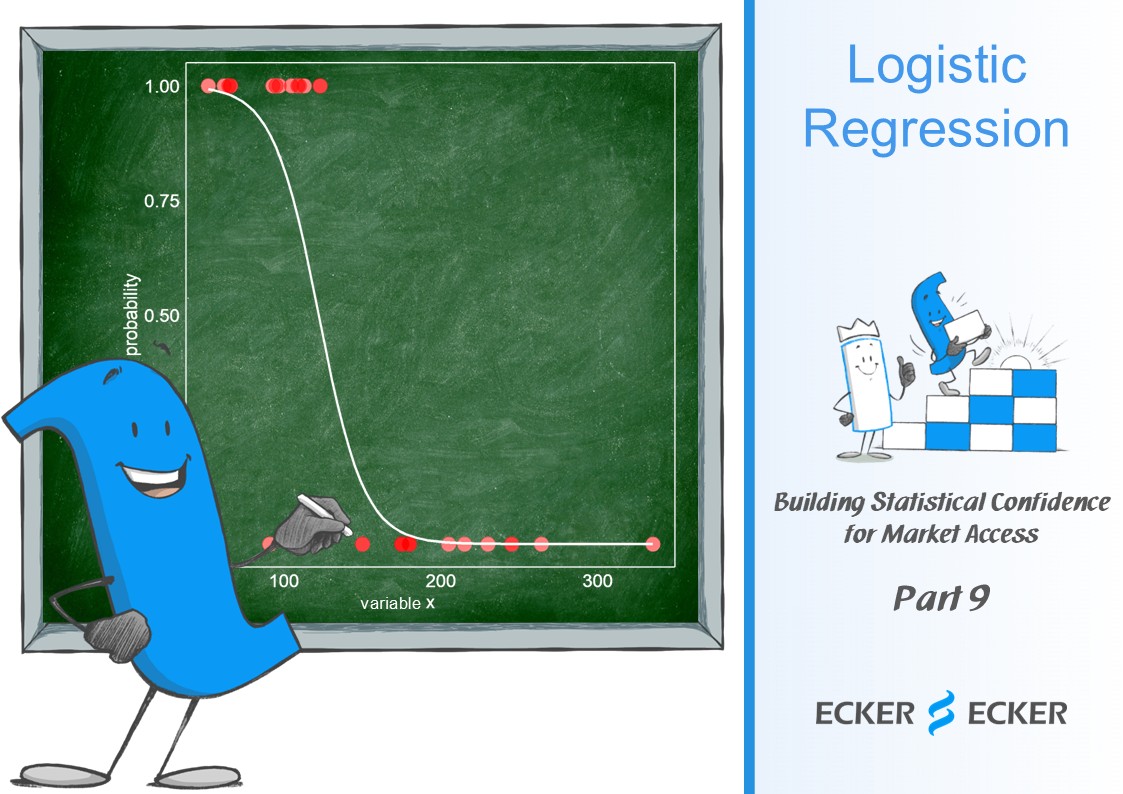
🛠️ We can incorporate the confounders by doing regression. But we have to be careful to choose the right regression model! Linear regression doesn't make a lot of sense when considering a binary outcome. The trick is to use a transformation: you don't consider the outcome itself, but its logit – i.e. the logarithm of its odds – instead. You can then apply linear regression and also calculate the odds ratio (OR).
Challenges
⚠️ You get the OR immediately, but what about risk ratio (RR) and risk difference (RD)?
⚠️ You run into problems when you have rare events.
Statistical Methods
📊 RR and RD can be computed using the Delta Method.
📊 In the case that you have rare events; you can use the Firth Correction.
Take Home Messages
⚠️When confounders come into play, a 2 by 2 table might not be the right choice.
💪But with logistic regression you can handle this situation!
📢 Stay tuned and continue Building Statistical Confidence For Market Access